VF ← All work
EDUCATIONAL SAAS · 2024

IT Smart
School

A high-density SaaS platform for AI & IT education — a modular dashboard and a centralised calendar hub that turn complex academic data into one clear, scalable interface.

ROLE
UX / UI Design
PLATFORM
Web · SaaS
TOOLS
Figma
Smart School dashboard — student, teacher and mentor profiles with schedule
01 / ABOUT THE PROJECT

Engineering order out of academic overload.

PROJECT OVERVIEW

Smart School is a technical UI/UX project focused on designing a high-density SaaS platform for AI and IT education. My task was to engineer a modular dashboard system that organises complex academic data, grading matrices and intensive schedules into a clear, scalable interface.

KEY OBJECTIVES
Student Hub
Performance, attendance and scheduling in one view.
Teacher Suite
Sorting, search and grade management at scale.
Data Visualisation
Progress milestones and structured, readable tables.
02 / DESIGN PROCESS

A full cycle — from empathy to execution.

01
Empathy & Discovery

Immersed in the user journey to understand the emotional and technical friction inside students’ and tutors’ daily academic routines.

02
Problem Definition

Synthesised research into four core challenges: cognitive overload, data fragmentation, scheduling friction and a lack of visual hierarchy.

03
System Development

Crafted a robust style guide — a strict modular grid, a screen-optimised typeface and a functional colour palette — to ensure interface scalability.

04
Interface Execution

Engineered a high-fidelity dashboard and a centralised calendar hub to deliver a seamless, unified experience for every platform user.

03 / USER PERSONAS

Two users. Two very different jobs.

AM
Alex May
42 · Teacher · Kyiv
PAIN POINT

Managing vast amounts of academic data for complex AI projects leads to administrative burnout. Manual grading and attendance for large groups is slow and error-prone.

GOAL

A data-dense “Teacher’s Journal” for rapid sorting, automated grade management and clear visualisation of student motivation.

MF
Martin Finnan
32 · Student · Orlando
PAIN POINT

Overwhelmed by the high-intensity schedule and technical demands of the AI curriculum. Hard to track progress across homework, expertise and upcoming live-coding sessions.

GOAL

A centralised dashboard to watch milestones in real time, see the day at a glance and reach mentor support to close knowledge gaps.

04 / PROBLEM DEFINITION

Four frictions standing between users and their goals.

Cognitive Overload

Students and teachers struggle with the massive volume of complex AI curriculum data and fragmented educational metrics.

Data Fragmentation

Grades, attendance and schedules are scattered across different tools, leading to poor academic management.

Lack of Hierarchy

Existing interfaces fail to prioritise critical alerts and milestones, making it hard to focus on what matters most.

Scheduling Friction

Managing high-intensity IT course timelines is hard without a centralised, visual hub that updates in real time.

05 / USER FLOW

Every path a user can take.

Three roles, one platform. Switch role, then tap any step to see where it leads and the edge cases it handles.

Log in → Student Dashboard → the student can…
Reads performance at a glance

Opens Overview to see attendance, homework and project bars plus a star rating — the gamified feedback that keeps motivation visible.

Edge · new student, low scores
Scans the week in colour

Opens the Calendar in Week view — lectures, live coding, reviews and breaks are colour-coded so the day parses instantly.

Switch Day / Month / YearSearch events
Jumps into the next session

From Next Events, opens a session card and joins live coding or a webinar — the chronological markers keep the order clear.

Edge · nothing upcoming → empty state
Reaches a mentor directly

Opens Messenger, searches a conversation, sends a message or starts a call to close a knowledge gap — resolving Data Fragmentation.

Unread badgesLight / dark thread
Works through assignments

Opens the Tasks queue (badge count 35), reviews what is due and marks items complete — the live counter keeps focus on what is left.

Edge · zero tasks → inbox-zero state
ANY SCREEN:Toggle light / darkSwitch courseLog out
Log in → Teacher Dashboard → the teacher can…
Opens the full cohort table

The Teacher’s Journal lists every student with group, HW, attendance, projects and mark — sortable and searchable for scanning large groups fast.

Sort by name / markFilter by groupPaginate · 10/page
Edits grades and attendance

Updates HW, attendance, project and mark inline — the data-dense layout keeps the edited row anchored, directly answering Alex’s goal.

Bulk-select rowsEdge · missing submission
Lays out the teaching week

Places lectures, reviews and live-coding blocks across the Calendar — colour keeps each session type legible at a glance.

Day / Week / Month / Year
Replies to students & colleagues

Opens Messenger to answer a student, a colleague or the Course Bot — unread counts flag what needs attention first.

Start audio / video call
ANY SCREEN:Toggle light / darkSwitch courseLog out
Log in → Mentor Dashboard → the mentor can…
Checks mentee performance

Reads the mentor card — industry expertise, encouraging growth and hands-on support — to decide where to step in next.

Progress bars & ratings
Answers a mentee thread

Opens Messenger and replies on a project module — the same thread the student sees, in light or dark.

Online status
Schedules a mentoring slot

Books a one-on-one in the Calendar so the mentee sees it in their own Next Events feed.

Reappears in student flow
ANY SCREEN:Toggle light / darkLog out
06 / THE SOLUTION

One hub. Every metric where you expect it.

A unified sidebar, a personalised dashboard, a colour-blocked calendar, a data-dense journal and an in-app messenger — one system that resolves the four frictions and gives every role a single source of truth.
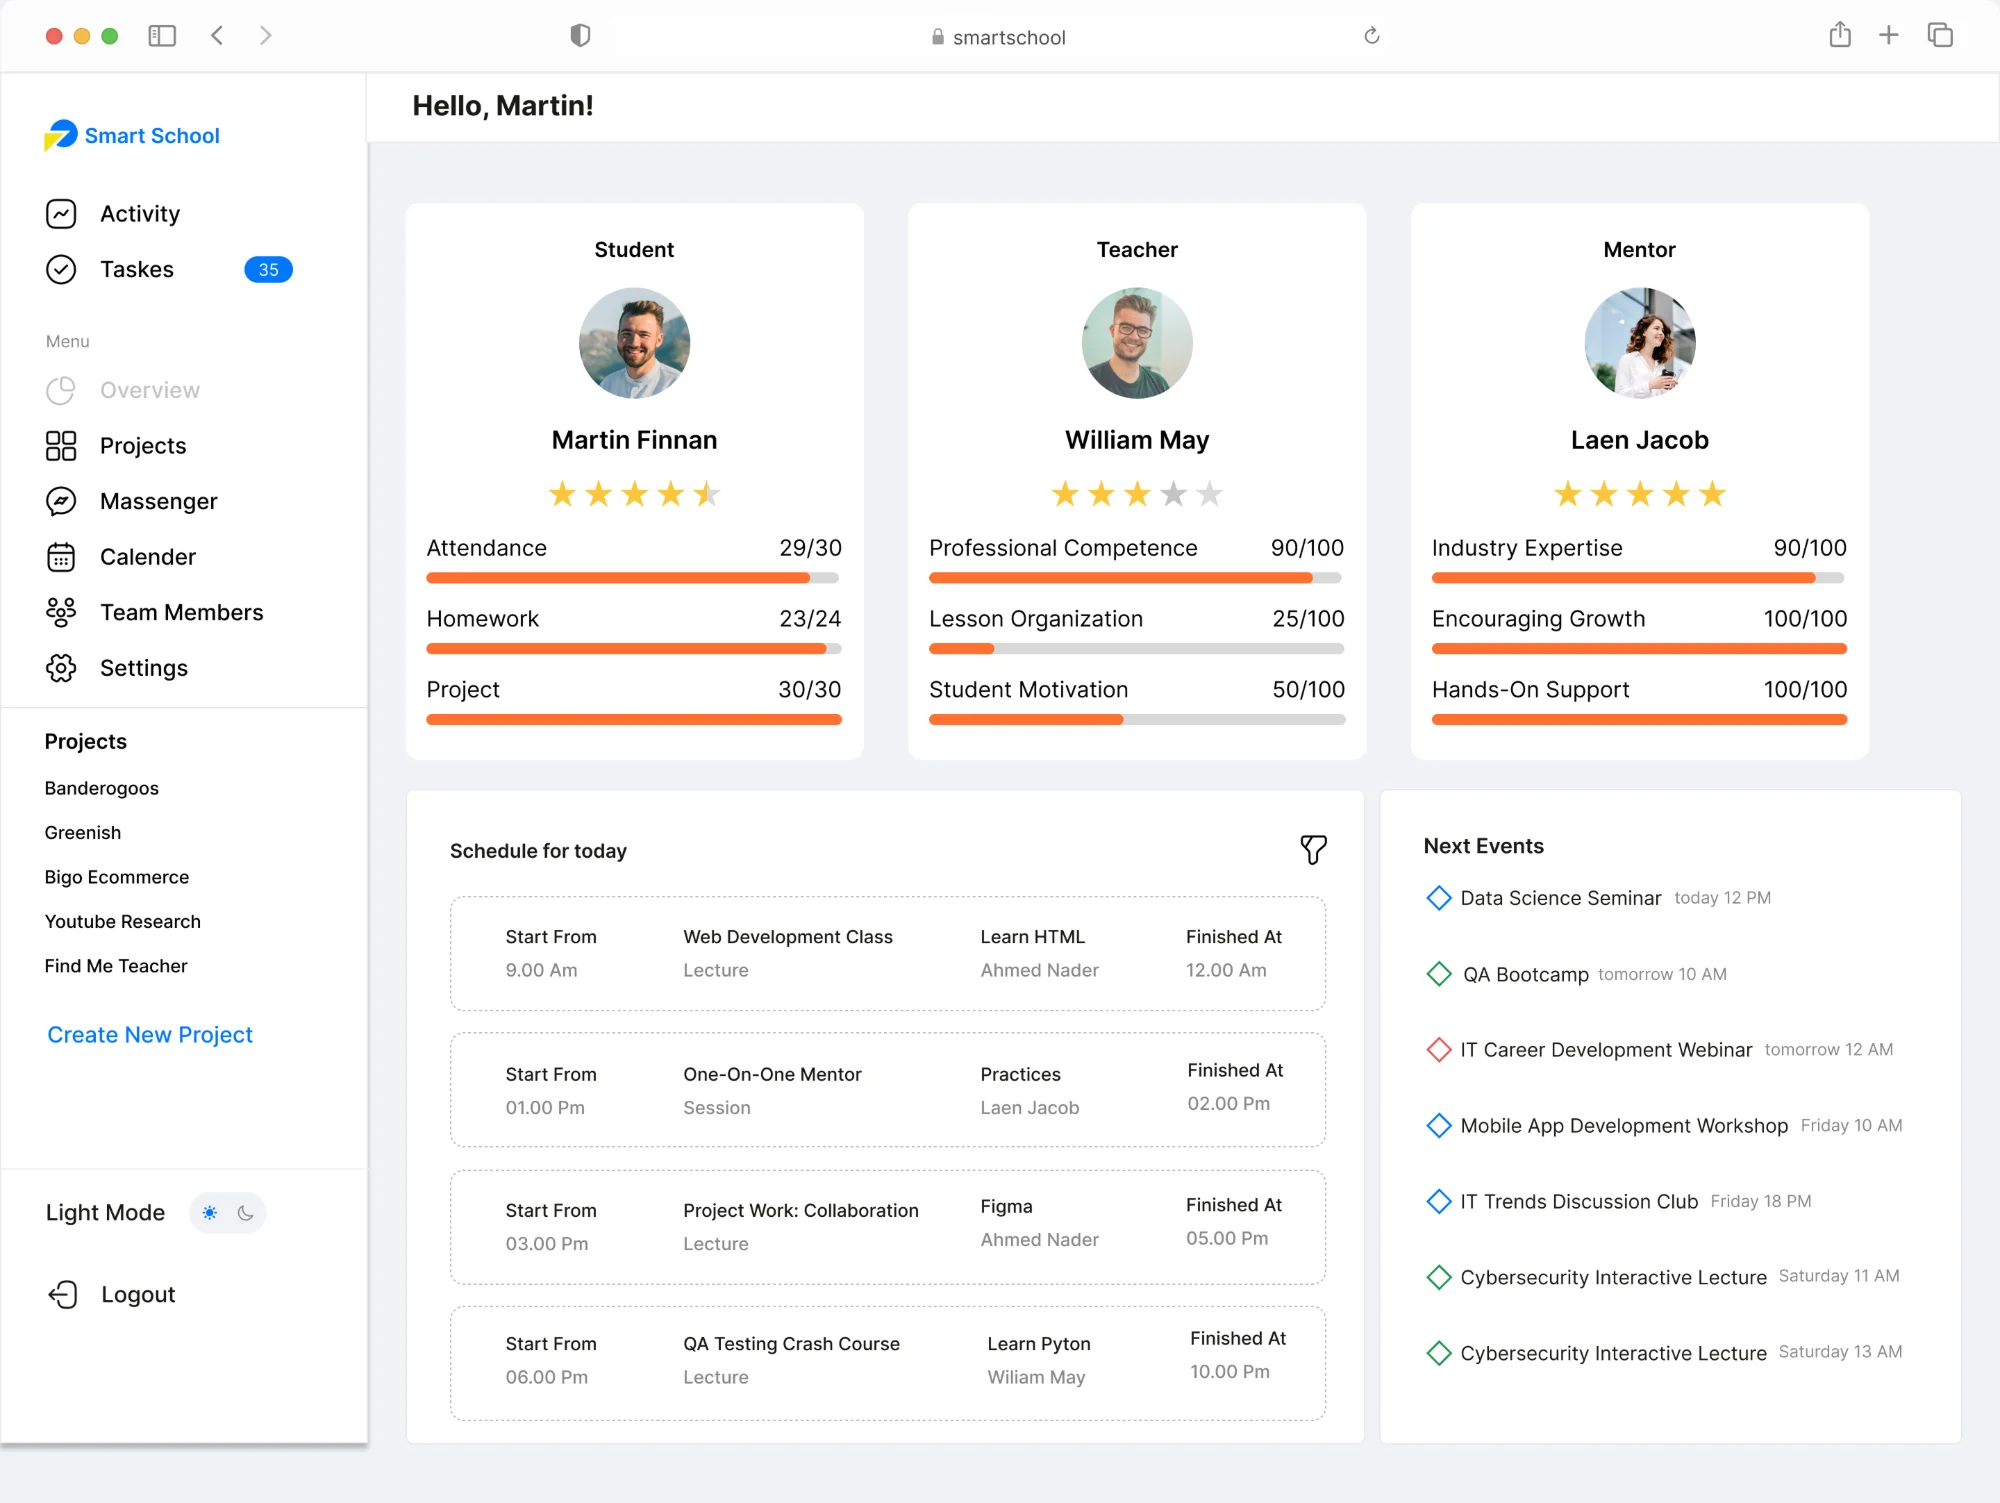
Smart School dashboard — student, teacher and mentor cards with progress bars, today's schedule and next events
A · THE DASHBOARD Student · Teacher · Mentor overview — every metric in one glance.
Unified navigation

One sidebar folds projects, messaging and schedules together — resolving Data Fragmentation.

Personalised greeting

Profile-specific metrics and a direct greeting make a dense tool feel human.

Gamified progress

Star ratings and high-contrast bars give instant feedback on performance.
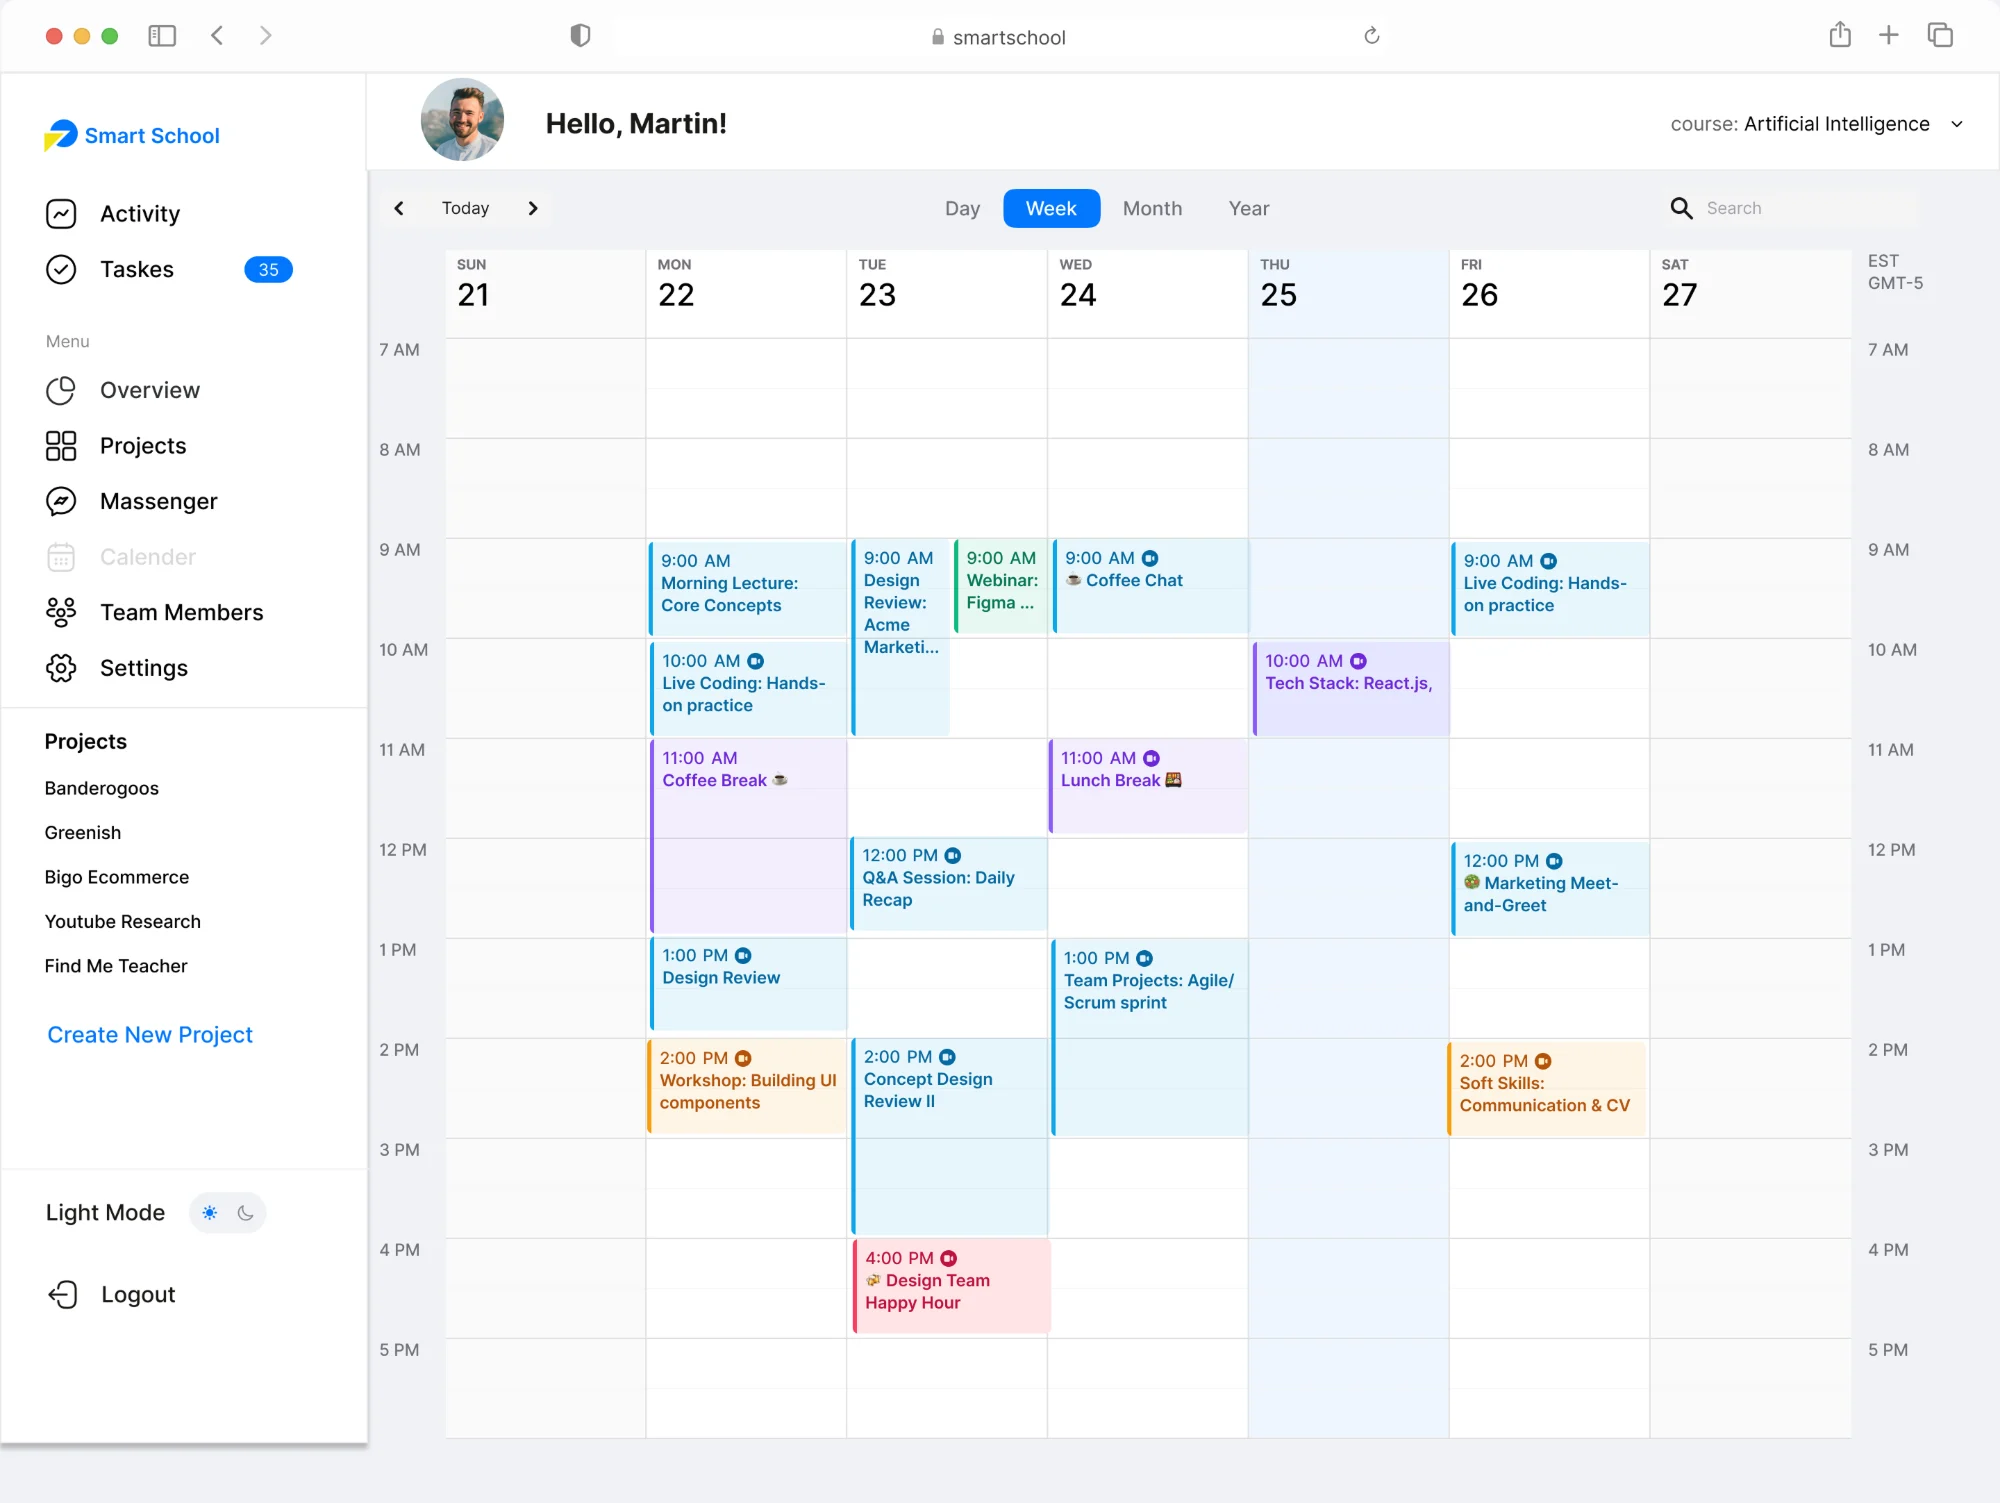
Week calendar with colour-coded time blocks for different session types
B · CENTRALISED CALENDAR HUB

Colour tells you the session at a glance

Distinct visual time-blocks let users recognise different session types instantly — lectures, live coding, reviews and breaks — removing Scheduling Friction. Day / Week / Month / Year views keep the whole timeline one click away.

Colour-coded blocks 4 time scales Contextual event markers
C · TEACHER’S JOURNAL

A data-dense table that stays readable

The journal answers Alex’s goal directly: rapid sorting and search, grouped cohorts, and grade / attendance columns tuned for scanning large groups without losing the row you care about.
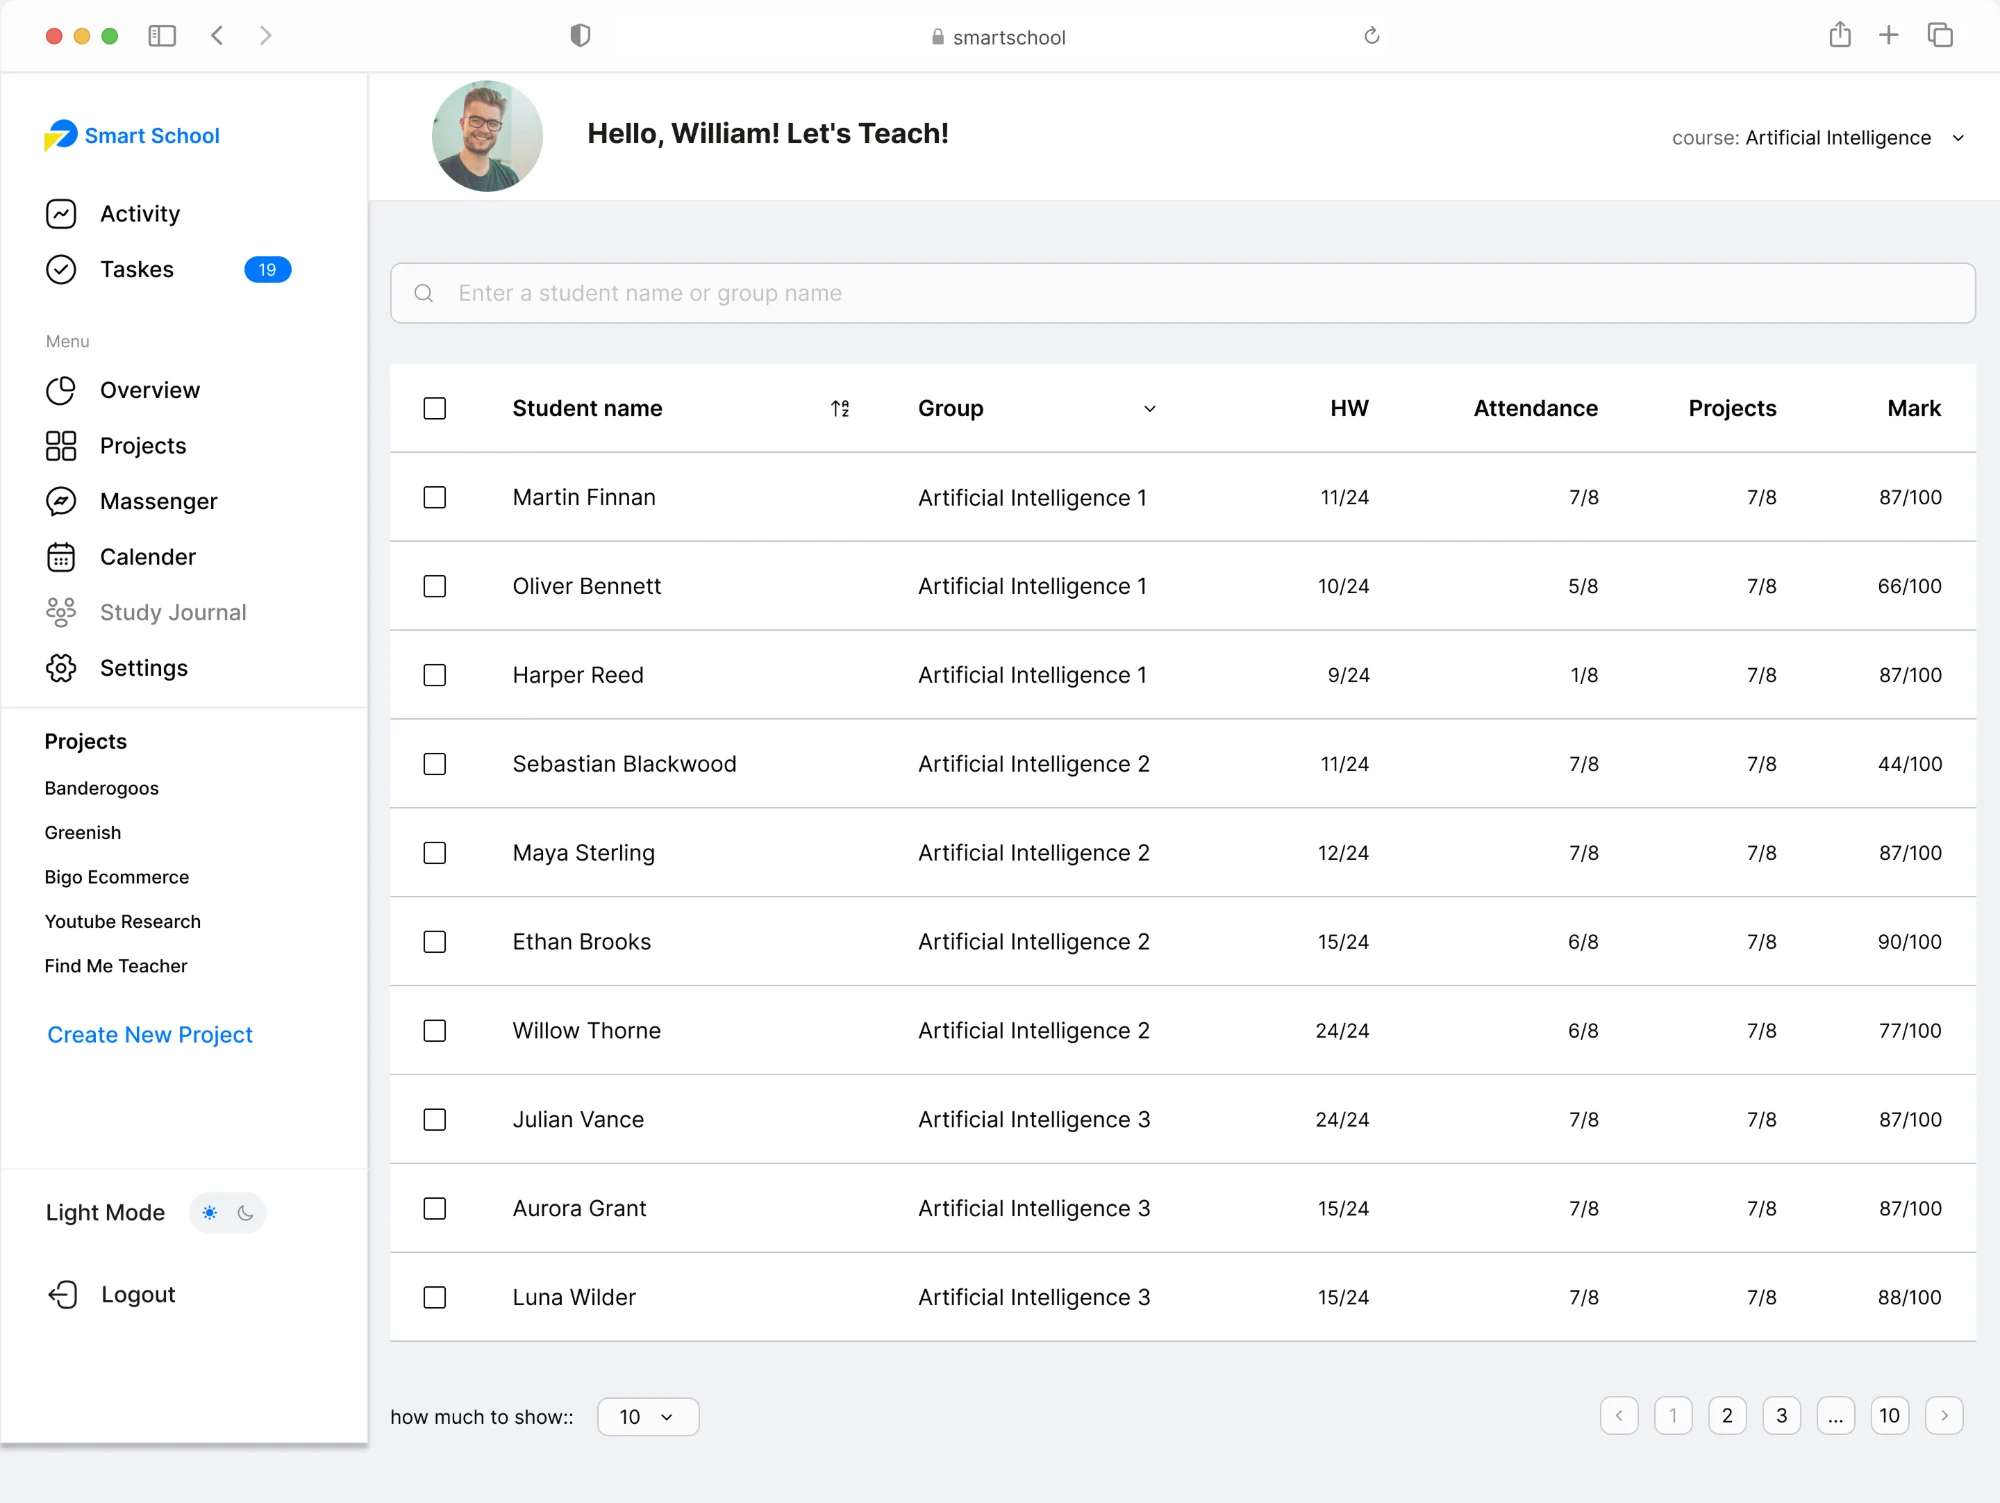
Sort & search Grade management Pagination
Teacher's journal — sortable table of students with group, homework, attendance, projects and mark columns
D · MESSENGER · ONE SYSTEM, TWO THEMES

Built for light and dark from the same components

A token-driven theme lets the in-app messenger — and every surface — switch between light and dark without a redesign, cutting eye-strain for long study sessions and meeting accessibility expectations.
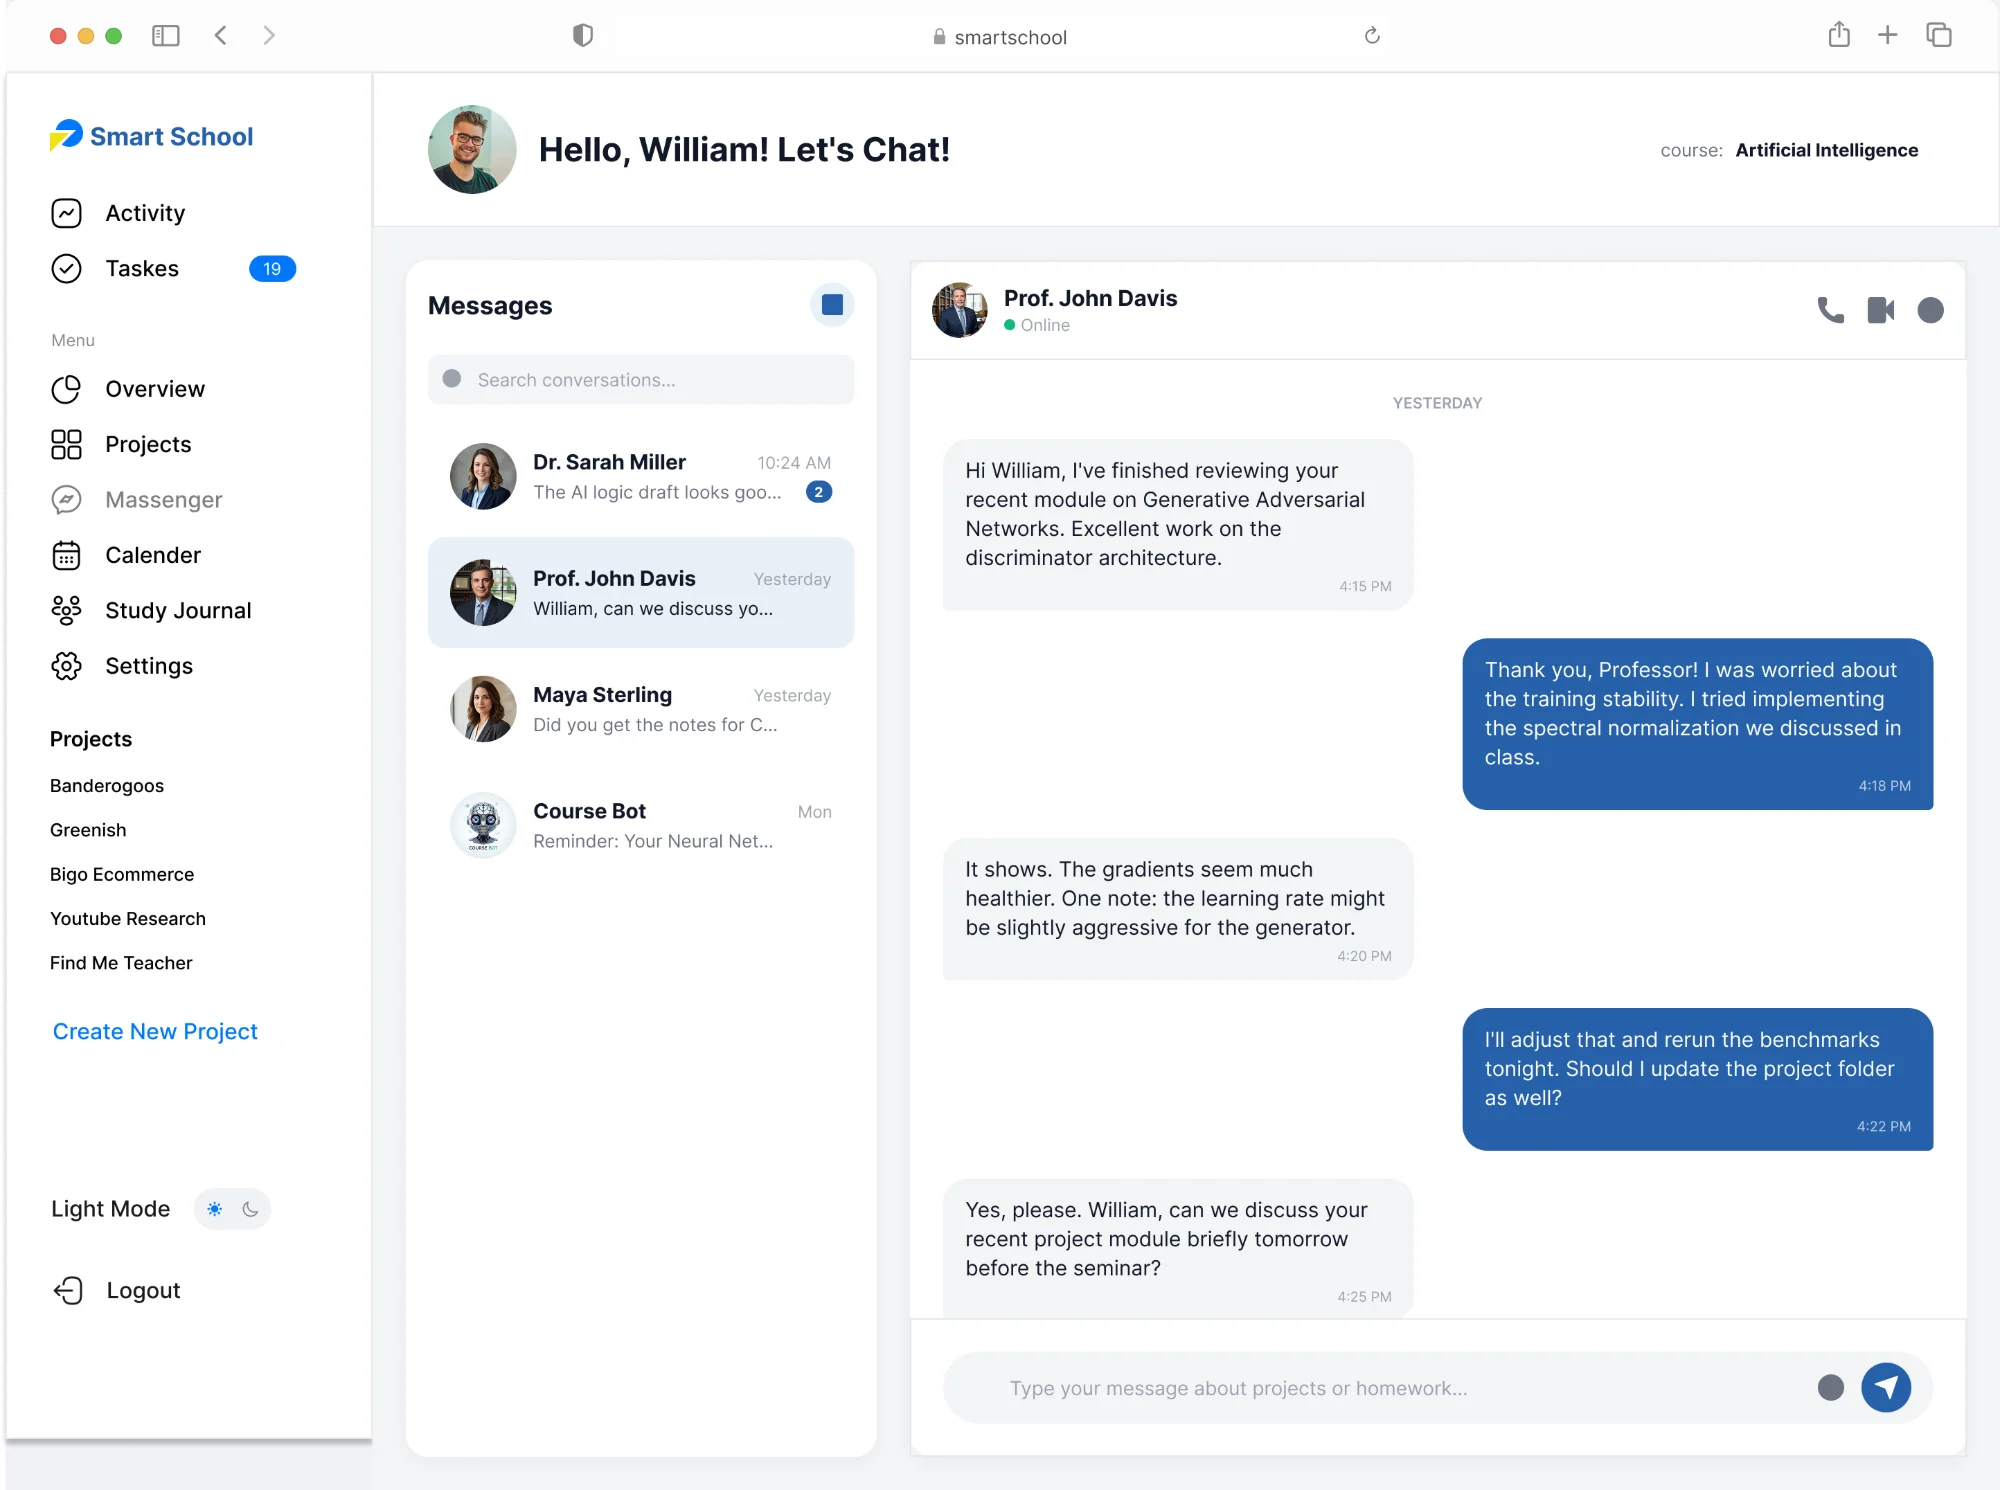
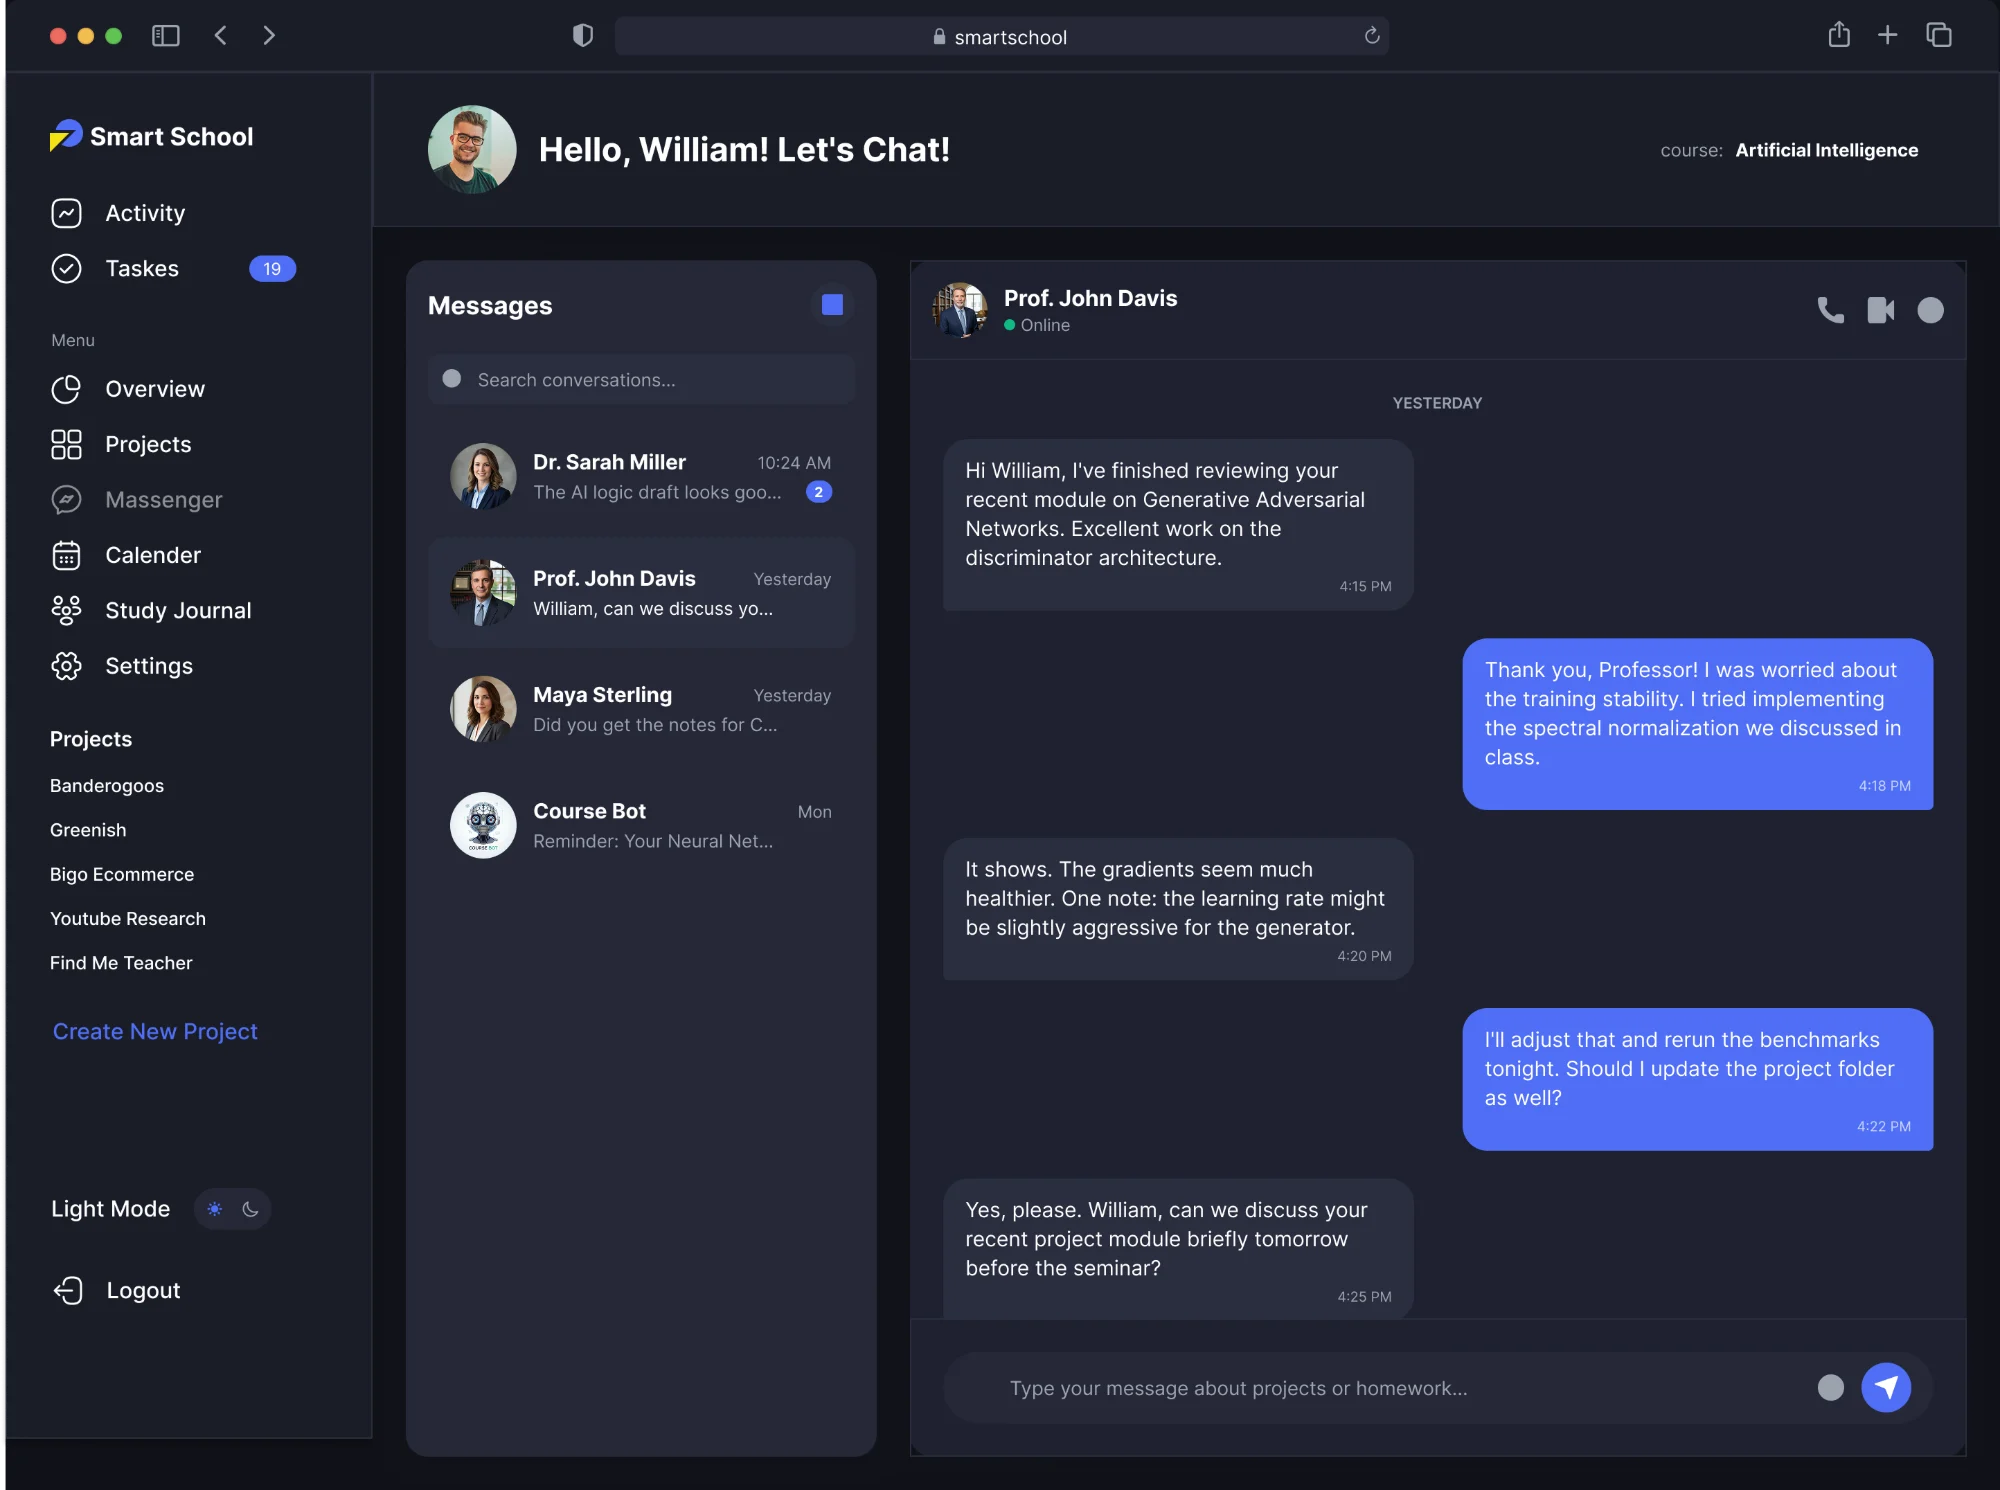
Messenger in light theme — conversation list and thread
LIGHT
Messenger in dark theme — conversation list and thread
DARK
07 / COLOURS & TYPEFACE

For this SaaS product, I chose Inter.

Inter was designed for screens. It balances technical precision with high readability — essential when the interface is dense with grading matrices and schedules.

Aa
REGULAR
Aa
MEDIUM
Aa
BOLD
Aa
BLACK
PRODUCT PALETTE
#0177FD
#1071A5
#7838DC
#BE123C
#FF6E2B
#FCC63A
#0A7C5B
#E7F8F2
#EFF6FF

A functional palette: blues carry the core UI, warm accents flag status and progress, soft tints hold dense data blocks apart.

LIKE WHAT YOU SEE?

Let’s design your platform next.

Start a project →
NEXT PROJECT
Mocktail Finder
→